AI Monitoring Tools Are Changing How Businesses Detect Problems and Reduce Costs
Learn how AI monitoring tools reduce downtime, detect issues faster, cut operational costs, and improve observability with real-world data and industry research.
For most of the last two decades, enterprise monitoring operated on a simple premise: a human defines what "broken" looks like, encodes it as a threshold, and the system pages someone when the threshold is crossed. That premise held while systems were small enough for a person to hold in their head. It stopped holding somewhere around the point where a single retail checkout flow began touching forty microservices, three cloud regions, two content delivery networks, and a payment processor with its own opaque failure modes.
The consequence is measurable, and it is not primarily a resolution problem. It is a detection problem. Organizations have become significantly faster at fixing failures once they understand them, and barely faster at noticing them in the first place. AI monitoring tools are being bought, at scale and at speed, to close that specific gap.
The detection gap is where the money is actually lost
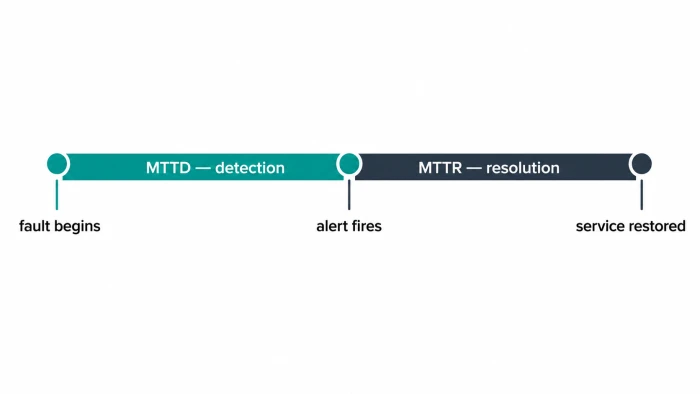
The most useful framing for this market comes from separating two metrics that are routinely collapsed into one. Mean time to detect (MTTD) measures the interval between a fault beginning and anyone knowing about it. Mean time to resolve (MTTR) measures everything after. Only the second is under direct engineering control, and only the first is nearly pure waste, because nothing is happening during it except accumulating damage.
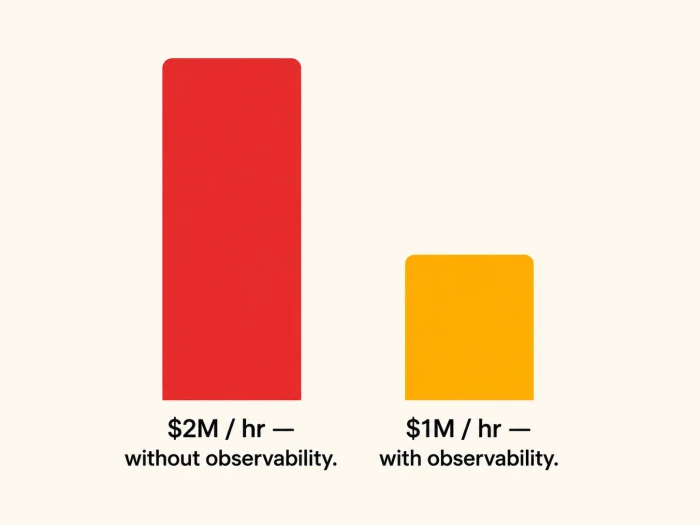
New Relic's 2025 Observability Forecast, based on responses from 1,700 engineering and IT leaders across 23 countries, put the median cost of a high business impact outage at $2 million per hour, roughly $33,333 per minute. The same research found that organizations with full stack observability in place reported that figure at approximately $1 million per hour, half the cost of organizations without it. That difference is not a discount on repair work. It is the arithmetic of catching a fault earlier in its blast radius.
The retail cut of that data is more revealing than the headline. Retailers reported a median detection time of 30 minutes and a median resolution time of 42 minutes. Detection therefore consumed roughly 42 percent of total incident duration, and it did so before a single engineer had begun useful work. Retail was faster than the cross industry figure, not slower.
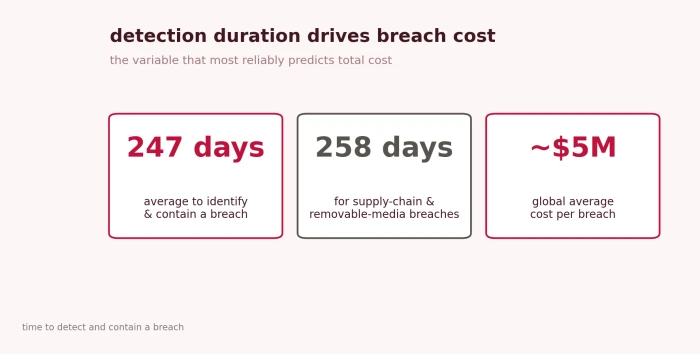
The security side of the ledger runs on a different timescale and tells the same story. IBM's 2026 Cost of a Data Breach study, conducted with Ponemon Institute, reported that the average time to identify and contain a breach rose for the first time in five years, climbing 2.5 percent year over year to an average of 247 days across all attack types. Breaches originating in removable media or supply chain compromise averaged 258 days, largely because neither shows up in malware scans or inbound traffic inspection. Global average breach cost rose approximately 12 percent to just under $5 million, with the United States average reaching $11.5 million.
Detection duration, in other words, is the variable that most reliably predicts total cost across both operational and security incidents. That is the market AI monitoring is selling into.
What changed technically, and why thresholds stopped working
The shift is not that AI was applied to monitoring. Statistical anomaly detection has existed in network management tooling since the 1990s. The shift is that four distinct capabilities matured at once and became purchasable as a single layer.
Learned baselines instead of static thresholds. A fixed alert at 80 percent CPU is wrong twice: it fires during a legitimate batch job and stays silent during a memory leak that never touches CPU. Baseline models learn seasonality per service, per region, per day of week, and flag deviation from expected behavior rather than deviation from a number a human guessed at eighteen months ago.
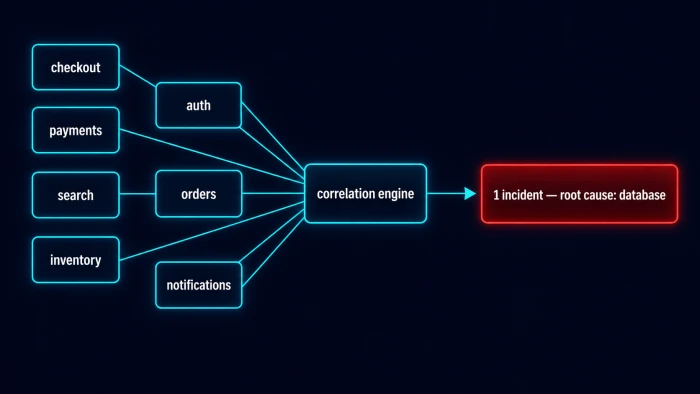
Topology aware event correlation. A single database degradation in a distributed system produces alerts from every downstream service. Correlation engines traverse the dependency graph and collapse the alert storm into one incident with an identified origin. This is the capability that most directly attacks alert fatigue, and it is the one buyers most consistently underweight during evaluation.
Causal root cause analysis. Rather than surfacing correlated metrics for a human to interpret, causal engines follow dependency direction to nominate a specific origin entity and change event. New Relic's survey ranked automatic root cause analysis as the second most impactful AI capability for incident response, cited by 33 percent of leaders, behind AI assisted troubleshooting at 38 percent and ahead of predictive analytics at 32 percent.
Forecasting and pre failure detection. The most economically significant capability, and the least mature. This is the difference between an alert and a warning, and it is what converts monitoring spend from an insurance cost into an avoided cost.
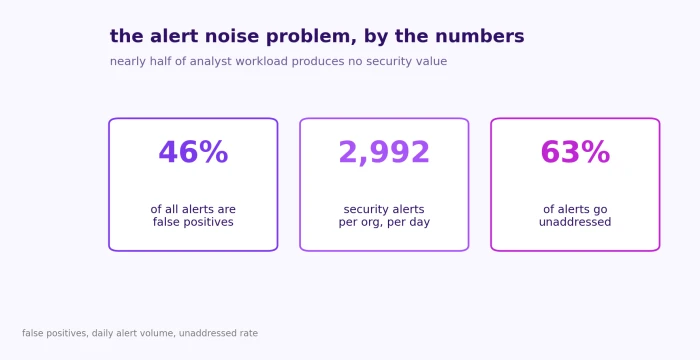
The noise problem those capabilities address is severe and well documented. The 2025 SANS Detection and Response Survey found 73 percent of security teams naming false positives as their single largest detection challenge. Microsoft and Omdia's State of the SOC 2026 research put the false positive rate at 46 percent of all alerts, meaning nearly half of analyst workload generates no security value, and found organizations operating an average of 10.9 separate security consoles. Vectra AI's 2026 research reported an average of 2,992 daily security alerts per organization with 63 percent going unaddressed, alongside 69 percent of organizations running ten or more detection tools and 39 percent running twenty or more.
An alert nobody reads is functionally identical to no monitoring at all, except that it costs money.
Adoption crossed the majority threshold in 2025
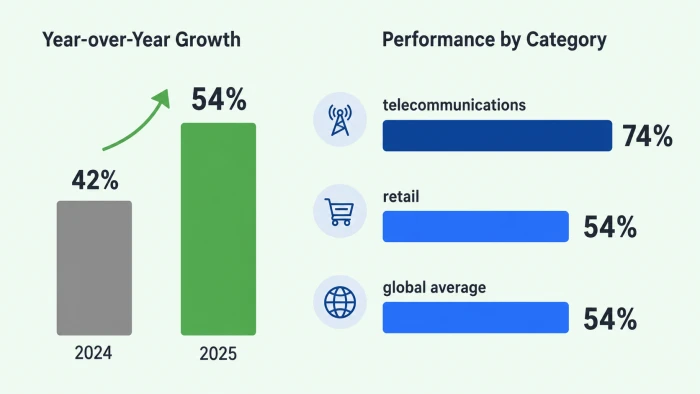
New Relic's survey recorded AI monitoring capability adoption moving from 42 percent in 2024 to 54 percent in 2025, the first year it entered the majority of surveyed organizations. Sector variance is wide: 74 percent of telecommunications organizations had deployed AI monitoring, against a 54 percent global average. That is not coincidental. Telecommunications respondents also reported the highest incident frequency, with 57 percent experiencing high business impact outages weekly or more often, against 27 percent for technology companies.
Forward projections are considerably more aggressive. Gartner's Predicts 2026 research, published in December 2025, assumes 70 percent of enterprises will deploy agentic AI as part of IT infrastructure operations by 2029, from less than 5 percent in 2025, with human in the loop involvement in IT operations workflows falling to 40 percent by 2028 from 95 percent in 2025. Separately, Gartner projected in May 2026 that 40 percent of organizations deploying AI will implement dedicated AI observability tooling by 2028 to monitor model performance, bias, and outputs.
A note on market sizing, because this is where most coverage of the category becomes unreliable. Published AIOps market estimates for 2026 range from roughly $2.7 billion to roughly $28.7 billion depending on the research firm. The spread is not a disagreement about growth. It is a disagreement about scope: whether services revenue is bundled, whether adjacent observability platform subscriptions count, and whether generative AI premium tiers layered onto existing contracts are counted separately. Any single figure quoted without its scope definition should be treated as decoration rather than data.
Where the cost reduction actually shows up
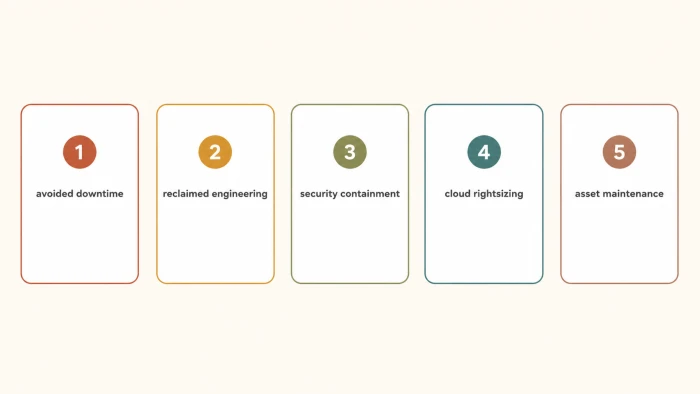
Vendor material tends to present a single ROI number. In practice the savings arrive from five structurally different pools, on different timelines, with different levels of evidentiary support.
1. Avoided and shortened downtime
This is the largest pool and the best evidenced. New Relic found 55 percent of leaders naming reduced unplanned downtime as the top business benefit of observability investment, ahead of operational efficiency at 50 percent and reduced security risk at 46 percent. Seventy five percent of respondents reported positive return on observability investment, with 18 percent reporting between three and ten times return.
2. Reclaimed engineering capacity
The same research found engineers spending 33 percent of their time on firefighting. For practitioners specifically, the top reported benefits were reduced alert fatigue at 59 percent and faster troubleshooting and root cause analysis at 58 percent. In the retail sector, 60 percent of engineers spent at least a fifth of their time managing outages and 14 percent spent half their time or more. Recovering even a quarter of that capacity in a fifty person engineering organization is equivalent to several full time hires, which is why this pool often clears budget approval faster than the downtime argument.
3. Security containment
IBM's 2025 study quantified this directly: organizations using AI and automation extensively in security averaged $3.62 million per breach against $5.52 million for organizations that did not, a difference of approximately $1.9 million, with breach lifecycles roughly 80 days shorter. The 2026 edition adds an important qualification. Most organizations are applying AI agents to detection and containment while very few apply them to vulnerability management, which leaves exposures open for longer precisely as attackers automate vulnerability discovery.
4. Infrastructure and cloud rightsizing
Gartner classifies augmented FinOps, meaning algorithmically driven cloud budget planning and automated resource optimization, among the four highest impact AI operations technologies expected to reach mainstream adoption within two to five years, alongside agentic AI observability, agentic network operations, and multiagent systems.
5. Physical asset maintenance
The industrial case is the oldest and the most financially concentrated. Siemens' True Cost of Downtime 2024 report calculated that the world's 500 largest companies lose approximately $1.4 trillion annually to unplanned downtime, equal to 11 percent of combined revenues, up from $864 billion and 8 percent in 2019 and 2020. Automotive production lines were costed at $2.3 million per hour of stoppage, close to $600 per second.
The same report documents something more interesting than the headline. Incident frequency fell substantially over that period, with average monthly downtime incidents dropping from 42 to 25 and average monthly downtime hours at large plants falling from 39 to 27, while total cost rose 62 percent. Predictive maintenance is working. The value of each hour of lost production simply rose faster, driven by leaner inventory buffers, higher input costs, and tighter just in time scheduling.
Cost pool
Representative benchmark
Source
High impact IT outage
$2M per hour median, $1M with full stack observability
New Relic 2025 Observability Forecast
Manufacturing line stoppage
~$260,000 per hour average
Aberdeen Strategy and Research
Automotive production line
$2.3M per hour
Siemens True Cost of Downtime 2024
Data breach, global average
Just under $5M per incident
IBM 2026 Cost of a Data Breach
Data breach, AI and automation deployed
$3.62M versus $5.52M
IBM 2025 Cost of a Data Breach
Sector evidence
Manufacturing. McKinsey research places predictive maintenance benefits at 18 to 25 percent reduction in overall maintenance cost and 30 to 50 percent reduction in unplanned downtime relative to reactive strategies. Deloitte figures circulate in two versions, one citing 30 to 50 percent downtime reduction and 10 to 40 percent maintenance cost reduction, another citing a more conservative 5 to 10 percent maintenance cost reduction and 10 to 20 percent uptime improvement. The conservative range is the defensible one for a capital request, because the aggressive range describes mature programs with tuned models rather than first year pilots. IoT Analytics research found 95 percent of organizations implementing predictive maintenance reporting positive return, with 27 percent achieving full payback inside twelve months. ABB's survey of more than 3,200 plant maintenance leaders found two thirds experiencing unplanned downtime at least monthly at an average cost of $125,000 per hour.
Financial services. This sector has the clearest false positive economics of any. Anti money laundering analysts typically review between 50 and 100 alerts daily, the overwhelming majority of which resolve as false positives, and some AML operations teams report annual staff turnover of 25 to 40 percent driven by the repetitive nature of that review work. Institutions that have replaced rule based transaction monitoring with behavioral and network analysis models report documented false positive reductions in the 50 to 60 percent range. Feedzai's 2025 AI Trends Report found 90 percent of financial institutions using AI for fraud detection. HSBC's anti money laundering deployment with Google Cloud monitors roughly 900 million transactions monthly across approximately 40 million accounts, a volume that has no manual equivalent at any staffing level.
Retail. Retailers reported a median high impact outage cost of $1 million per hour, half the cross industry figure, but with nearly one in three experiencing critical outages weekly. Half of retail leaders cited AI as the primary driver of their observability adoption, and the sector has consolidated its tooling more aggressively than any other, reducing from an average of 5.9 monitoring tools in 2022 to 3.9.
Telecommunications and media. Telecommunications outages were costed at $2 million per hour and IT organizations at $1.6 million, with 58 percent of telecommunications respondents reporting observability returns of two times or better. Media and entertainment reported $2 million per hour with 57 percent reporting returns of two times or better.
The counter evidence, which buyers should read first
An expert assessment of this category has to account for the substantial body of evidence that AI monitoring does not automatically deliver what is claimed for it.
Consolidation is not arriving on schedule. Gartner's 2026 Hype Cycle for AI in IT Operations, published in July 2026, directly contradicts the tool consolidation narrative that most vendors lead with. Gartner's position is that the near term outcome will be the reverse: more layers, more control points, and more specialized observability, orchestration, and management capabilities, with relief arriving only once vendor and market consolidation reduces the overall tooling footprint. Gartner also advises operations teams to plan on the increased likelihood of AI itself playing a role in an outage.
Projects are being cancelled at high rates. Gartner expects more than 40 percent of agentic AI projects to be cancelled by 2027, attributed to escalating costs, unclear return, and governance failures. A 2026 Gartner survey found 17 percent of enterprises had actually deployed AI agents, against far higher stated intent.
Models degrade quietly. Concept drift is the defining operational risk of this category and the one least discussed in sales cycles. An anomaly detection model trained on a given topology, software version, and traffic pattern loses accuracy as those change, and the degradation is gradual rather than abrupt. Without scheduled retraining and drift monitoring, a model that performed well at deployment produces progressively worse signal, and the failure mode is silence rather than error.
Observability spend is itself a cost problem. Gartner figures cited across industry analysis indicate 36 percent of enterprise clients spending over $1 million annually on observability and 4 percent exceeding $10 million, with more than half of that spend going to logs alone. Elastic's 2026 Observability Survey found 54 percent of IT decision makers facing increased pressure from leadership to justify observability expenditure, 70 percent seeking to optimize existing spend rather than expand or cut it, and 96 percent actively taking steps to control observability costs. Aggregated benchmarks from CNCF, Gartner, FinOps Foundation, and Flexera place median observability spend at 7 to 12 percent of total cloud infrastructure cost, rising to 8 to 15 percent for microservices and Kubernetes heavy stacks. AI workloads inflate all three axes vendors bill on: active metric series, log volume, and trace spans.
The adversary is compounding faster. IBM's 2026 study recorded a 56 percent year over year increase in AI driven attacks, with one in four organizations experiencing an AI driven breach, and AI involvement adding roughly $1 million to average breach cost. Shadow AI incidents more than doubled to 43 percent of security incidents from 20 percent the previous year, with an average breach cost of $5.39 million and one in five resulting in a regulatory fine. IBM reported an expert expectation that AI will favor attackers over defenders by 31.7 percent within two years. Defensive AI monitoring in this context is not producing advantage. It is preventing a widening deficit.
An evaluation framework that survives contact with a procurement process
The following sequence reflects what separates deployments that produce measurable return from those that produce a renewal argument.
Establish the baseline before the pilot, not during it. Any organization that cannot state its current MTTD, MTTR, alert volume, false positive rate, and hourly cost of downtime for its top five revenue critical services will be unable to demonstrate improvement afterward. This is the single most common reason AI monitoring investments fail to secure expansion budget, and it is entirely self inflicted. Baselines take two to four weeks to establish and are worth more than any vendor proof of concept.
Weight detection metrics above resolution metrics. Vendors preferentially report MTTR improvement because it is larger and easier to influence. MTTD improvement is the harder number and the more valuable one, because every minute removed from detection is a minute removed from total incident duration at zero engineering cost.
Demand false positive and false negative rates from the same evaluation window. A model tuned to suppress noise is trivially easy to build and dangerous to deploy. The metric that matters is noise reduction achieved while true positive detection is held constant or improved, measured against a known incident set.
Interrogate the pricing model against projected telemetry growth, not current volume. Ingest based and host based pricing produce radically different bills as architectures shift toward microservices, serverless, and AI workloads. Teams adding AI capabilities commonly see telemetry volume rise by multiples rather than percentages. A contract priced against today's volume becomes a renegotiation crisis in eighteen months.
Treat OpenTelemetry instrumentation as leverage. Instrumenting once against an open standard and routing telemetry to a chosen backend removes the switching cost that vendors have historically relied on, and it converts platform selection into an evaluation of analysis quality rather than an evaluation of how deeply agents are embedded in the codebase.
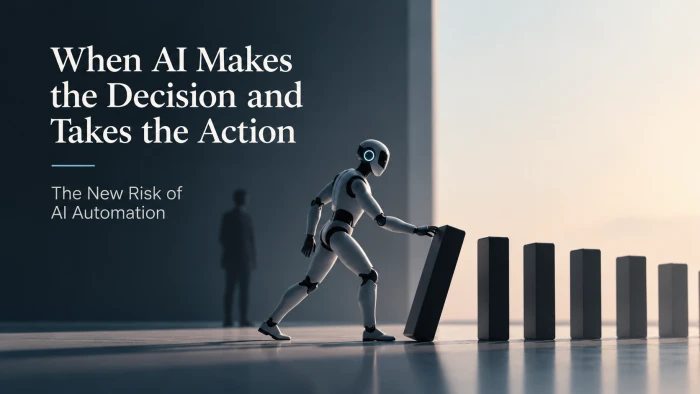
Stage automation in three phases. Recommendation only, then human approved execution, then automatic execution restricted to clearly reversible actions. Organizations that skip to automatic execution accumulate incidents in which the automation is the cause, which is precisely the risk Gartner advises planning for.
Define retraining ownership at contract signature. Someone must own drift monitoring, retraining cadence, and detection rule quality review. Where this is unassigned, model performance decays until the tool is quietly abandoned and the license continues to renew.
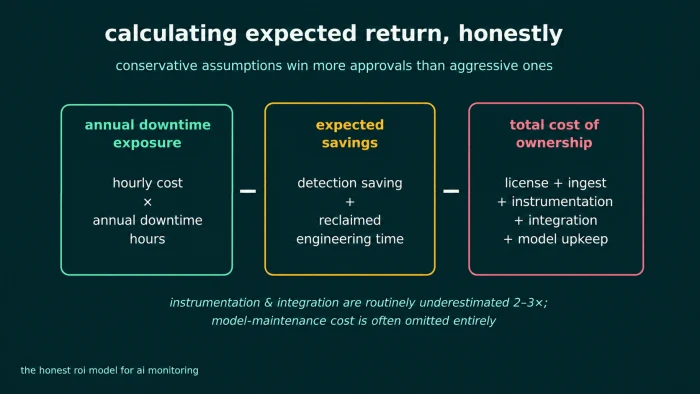
Calculating expected return honestly
The defensible model is straightforward and does not require vendor assistance.
Annual downtime exposure equals hourly cost of downtime multiplied by annual hours of unplanned downtime. Expected detection saving equals annual incident count multiplied by expected MTTD reduction in hours multiplied by hourly cost of downtime. Expected labor saving equals engineering headcount multiplied by fully loaded cost multiplied by current firefighting time share multiplied by expected reduction in that share.
Against that, the total cost of ownership must include license or ingest cost, instrumentation engineering effort, integration work against existing incident management tooling, and ongoing model maintenance. Instrumentation and integration are routinely underestimated by a factor of two to three, and the model maintenance line is frequently omitted entirely.
For budgeting purposes, conservative assumptions produce more approvals than aggressive ones. A 15 to 20 percent maintenance cost reduction assumption in an industrial context, or a 30 percent MTTD reduction assumption in an IT context, is defensible in a finance review. A ten times return assumption is not, even where it eventually proves accurate.
What to watch over the next eighteen months
Three developments will shape whether this category delivers on its economics.
The first is whether agentic AI observability, meaning tooling that monitors AI agents themselves for hallucination, goal misalignment, runaway token spend, and cascading multi agent failure, matures fast enough to keep pace with agent deployment. The large language model observability platform market was estimated at $2.69 billion in 2026, growing from $1.97 billion in 2025, with projections reaching $9.26 billion by 2030. Growth of that shape usually indicates a capability gap being filled under pressure rather than an orderly market.
The second is OpenTelemetry's continued displacement of proprietary instrumentation, which determines whether buyers retain negotiating leverage or return to vendor lock in under a new label.
The third is vendor consolidation. Gartner's expectation that tooling footprints shrink only after market consolidation implies that the promised simplification is a function of merger and acquisition activity rather than product capability. Buyers planning around near term consolidation are planning around something outside their control.



Discussion
Join the discussion and share your perspective.